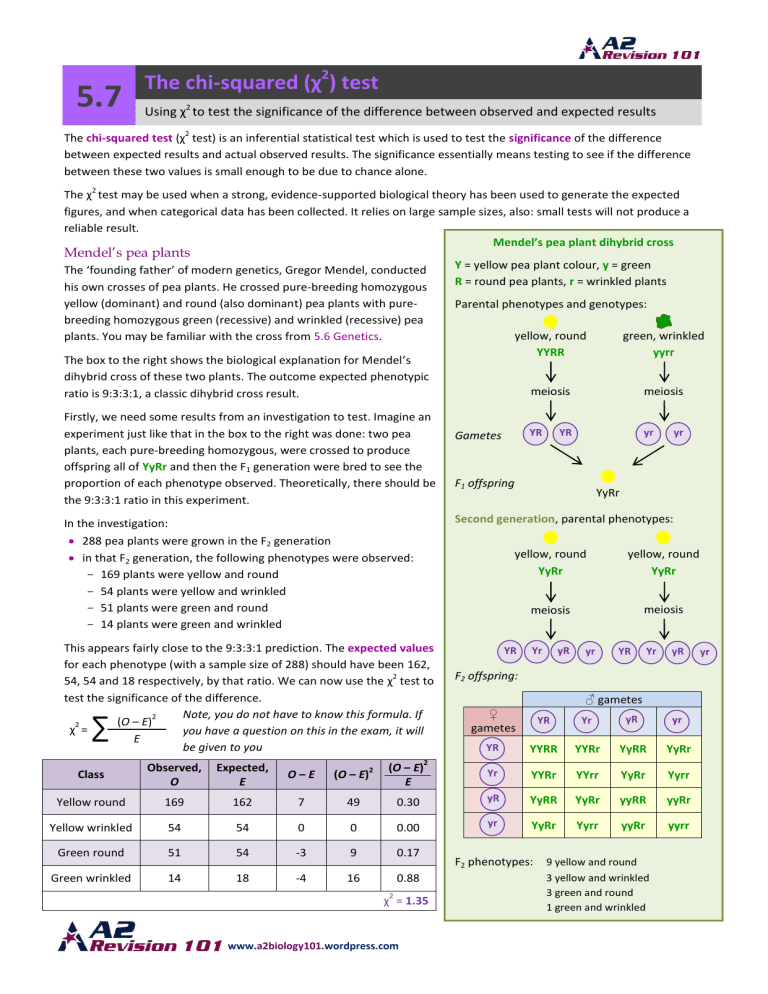
D 5.7 The chi-squared (χ2) test Using χ2 to test the significance of the difference between observed and expected results 2 The chi-squared test (χ test) is an inferential statistical test which is used to test the significance of the difference between expected results and actual observed results. The significance essentially means testing to see if the difference between these two values is small enough to be due to chance alone. 2 The χ test may be used when a strong, evidence-supported biological theory has been used to generate the expected figures, and when categorical data has been collected. It relies on large sample sizes, also: small tests will not produce a reliable result. Mendel’s pea plant dihybrid cross Mendel’s pea plants The ‘founding father’ of modern genetics, Gregor Mendel, conducted his own crosses of pea plants. He crossed pure-breeding homozygous yellow (dominant) and round (also dominant) pea plants with purebreeding homozygous green (recessive) and wrinkled (recessive) pea plants. You may be familiar with the cross from 5.6 Genetics. Y = yellow pea plant colour, y = green R = round pea plants, r = wrinkled plants Parental phenotypes and genotypes: The box to the right shows the biological explanation for Mendel’s dihybrid cross of these two plants. The outcome expected phenotypic ratio is 9:3:3:1, a classic dihybrid cross result. Firstly, we need some results from an investigation to test. Imagine an experiment just like that in the box to the right was done: two pea plants, each pure-breeding homozygous, were crossed to produce offspring all of YyRr and then the F1 generation were bred to see the proportion of each phenotype observed. Theoretically, there should be the 9:3:3:1 ratio in this experiment. green, wrinkled yyrr meiosis meiosis YR yr Gametes YR F1 offspring yr YyRr Second generation, parental phenotypes: In the investigation: 288 pea plants were grown in the F2 generation in that F2 generation, the following phenotypes were observed: - 169 plants were yellow and round - 54 plants were yellow and wrinkled - 51 plants were green and round - 14 plants were green and wrinkled This appears fairly close to the 9:3:3:1 prediction. The expected values for each phenotype (with a sample size of 288) should have been 162, 2 54, 54 and 18 respectively, by that ratio. We can now use the χ test to test the significance of the difference. Note, you do not have to know this formula. If 2 (O – E) 2 χ = you have a question on this in the exam, it will E be given to you ∑ yellow, round YyRr yellow, round YyRr meiosis meiosis YR Yr yR yr YR Yr yR F2 offspring: ♂ gametes ♀ gametes YR Yr yR yr YR YYRR YYRr YyRR YyRr Yr YYRr YYrr YyRr Yyrr 2 Class Observed, O Expected, E O–E (O – E) Yellow round 169 162 7 49 0.30 yR YyRR YyRr yyRR yyRr Yellow wrinkled 54 54 0 0 0.00 yr YyRr Yyrr yyRr yyrr Green round 51 54 -3 9 0.17 Green wrinkled 14 18 -4 16 0.88 2 (O – E) E yellow, round YYRR 2 χ = 1.35 www.a2biology101.wordpress.com F2 phenotypes: 9 yellow and round 3 yellow and wrinkled 3 green and round 1 green and wrinkled yr 2 The bigger the value of χ the more likely it is that there is a significant difference between the observed values and expected values, suggesting that the experimental hypothesis will need to be accepted, and vice versa, the smaller the 2 value of χ the less likely it is that there is a significant difference, and so any difference there is will be down to chance. This would mean that the experimental hypothesis can be rejected, and the null hypothesis accepted. Number of classes Degrees of freedom 2 1 0.00 0.10 0.45 1.32 2.71 3.84 5.41 6.64 3 2 0.02 0.58 1.39 2.77 4.61 5.99 7.82 9.21 4 3 0.12 1.21 2.37 4.11 6.25 7.82 9.84 11.34 5 4 0.30 1.92 3.36 5.39 7.78 9.49 11.67 13.28 6 5 0.55 2.67 4.35 6.63 9.24 11.07 13.39 15.09 0.99 (99%) 0.75 (75%) 0.50 (50%) 0.25 (25%) 0.10 (10%) 0.05 (5%) 0.02 (2%) 0.01 (1%) Probability that variation is due to chance alone, p= χ2 Accept null hypothesis (any difference is due to chance and not significant) Critical value 2 of χ where p=0.05, the level at which we are 95% certain that the result is not due to chance 2 Reject null hypothesis, accept experimental hypothesis (difference is significant and not due to chance) The degrees of freedom are always the number of categories, less one. In this case there are four classes, so the Df will be 3. The critical value found using the probability chosen to accept that the results are not due to chance, and that there is no significance in differences observed. Usually p=0.05 will be chosen for this. We can see that for 0.05 the critical value for 3 degrees of freedom is 7.82. With our χ value of 1.35, we can tell immediately that this is much less than 7.82, so we can conclude that the difference between the observed values and expected values was not significant. The results are consistent with the Mendelian genetic explanation, and the null hypothesis can be accepted. www.a2biology101.wordpress.com

