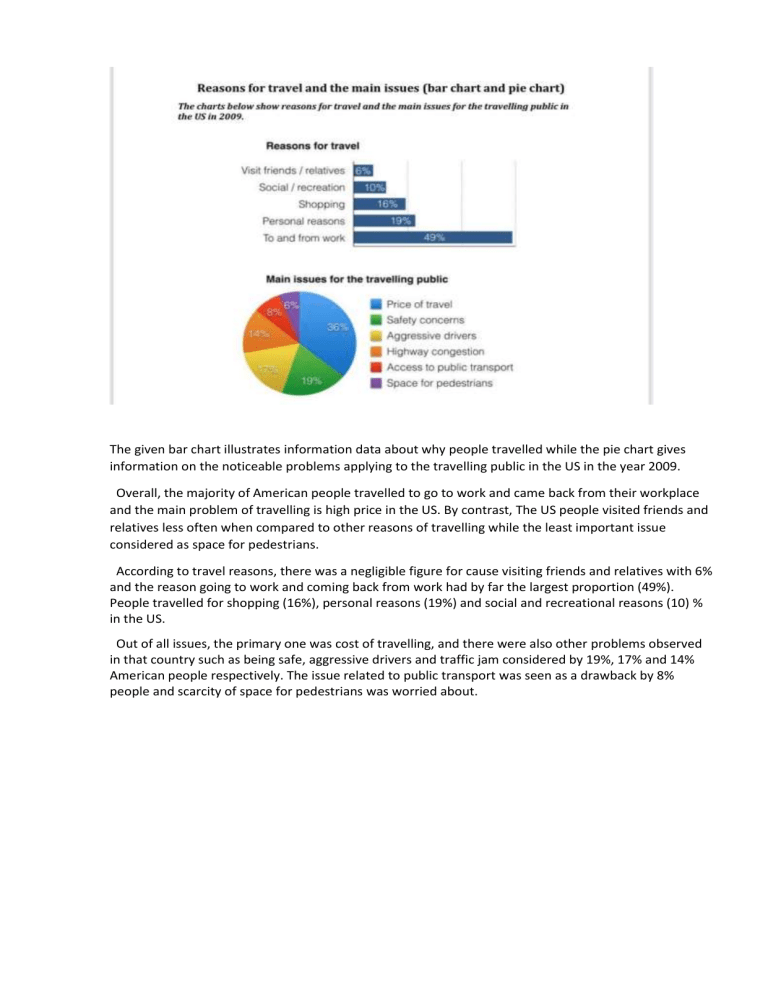
The given bar chart illustrates information data about why people travelled while the pie chart gives information on the noticeable problems applying to the travelling public in the US in the year 2009. Overall, the majority of American people travelled to go to work and came back from their workplace and the main problem of travelling is high price in the US. By contrast, The US people visited friends and relatives less often when compared to other reasons of travelling while the least important issue considered as space for pedestrians. According to travel reasons, there was a negligible figure for cause visiting friends and relatives with 6% and the reason going to work and coming back from work had by far the largest proportion (49%). People travelled for shopping (16%), personal reasons (19%) and social and recreational reasons (10) % in the US. Out of all issues, the primary one was cost of travelling, and there were also other problems observed in that country such as being safe, aggressive drivers and traffic jam considered by 19%, 17% and 14% American people respectively. The issue related to public transport was seen as a drawback by 8% people and scarcity of space for pedestrians was worried about.

