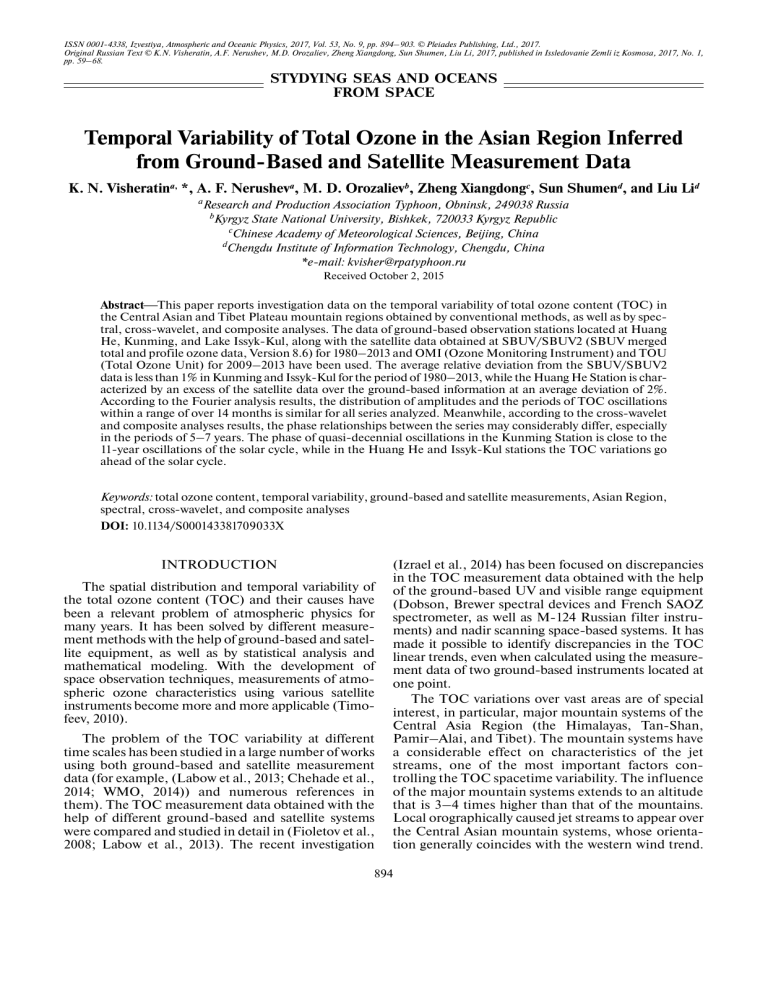
ISSN 0001-4338, Izvestiya, Atmospheric and Oceanic Physics, 2017, Vol. 53, No. 9, pp. 894–903. © Pleiades Publishing, Ltd., 2017. Original Russian Text © K.N. Visheratin, A.F. Nerushev, M.D. Orozaliev, Zheng Xiangdong, Sun Shumen, Liu Li, 2017, published in Issledovanie Zemli iz Kosmosa, 2017, No. 1, pp. 59–68. STYDYING SEAS AND OCEANS FROM SPACE Temporal Variability of Total Ozone in the Asian Region Inferred from Ground-Based and Satellite Measurement Data K. N. Visheratina, *, A. F. Nerusheva, M. D. Orozalievb, Zheng Xiangdongc, Sun Shumend, and Liu Lid aResearch and Production Association Typhoon, Obninsk, 249038 Russia Kyrgyz State National University, Bishkek, 720033 Kyrgyz Republic c Chinese Academy of Meteorological Sciences, Beijing, China d Chengdu Institute of Information Technology, Chengdu, China *e-mail: kvisher@rpatyphoon.ru b Received October 2, 2015 Abstract⎯This paper reports investigation data on the temporal variability of total ozone content (TOC) in the Central Asian and Tibet Plateau mountain regions obtained by conventional methods, as well as by spectral, cross-wavelet, and composite analyses. The data of ground-based observation stations located at Huang He, Kunming, and Lake Issyk-Kul, along with the satellite data obtained at SBUV/SBUV2 (SBUV merged total and profile ozone data, Version 8.6) for 1980–2013 and OMI (Ozone Monitoring Instrument) and TOU (Total Ozone Unit) for 2009–2013 have been used. The average relative deviation from the SBUV/SBUV2 data is less than 1% in Kunming and Issyk-Kul for the period of 1980–2013, while the Huang He Station is characterized by an excess of the satellite data over the ground-based information at an average deviation of 2%. According to the Fourier analysis results, the distribution of amplitudes and the periods of TOC oscillations within a range of over 14 months is similar for all series analyzed. Meanwhile, according to the cross-wavelet and composite analyses results, the phase relationships between the series may considerably differ, especially in the periods of 5–7 years. The phase of quasi-decennial oscillations in the Kunming Station is close to the 11-year oscillations of the solar cycle, while in the Huang He and Issyk-Kul stations the TOC variations go ahead of the solar cycle. Keywords: total ozone content, temporal variability, ground-based and satellite measurements, Asian Region, spectral, cross-wavelet, and composite analyses DOI: 10.1134/S000143381709033X INTRODUCTION The spatial distribution and temporal variability of the total ozone content (TOC) and their causes have been a relevant problem of atmospheric physics for many years. It has been solved by different measurement methods with the help of ground-based and satellite equipment, as well as by statistical analysis and mathematical modeling. With the development of space observation techniques, measurements of atmospheric ozone characteristics using various satellite instruments become more and more applicable (Timofeev, 2010). The problem of the TOC variability at different time scales has been studied in a large number of works using both ground-based and satellite measurement data (for example, (Labow et al., 2013; Chehade et al., 2014; WMO, 2014)) and numerous references in them). The TOC measurement data obtained with the help of different ground-based and satellite systems were compared and studied in detail in (Fioletov et al., 2008; Labow et al., 2013). The recent investigation (Izrael et al., 2014) has been focused on discrepancies in the TOC measurement data obtained with the help of the ground-based UV and visible range equipment (Dobson, Brewer spectral devices and French SAOZ spectrometer, as well as M-124 Russian filter instruments) and nadir scanning space-based systems. It has made it possible to identify discrepancies in the TOC linear trends, even when calculated using the measurement data of two ground-based instruments located at one point. The TOC variations over vast areas are of special interest, in particular, major mountain systems of the Central Asia Region (the Himalayas, Tan-Shan, Pamir–Alai, and Tibet). The mountain systems have a considerable effect on characteristics of the jet streams, one of the most important factors controlling the TOC spacetime variability. The influence of the major mountain systems extends to an altitude that is 3–4 times higher than that of the mountains. Local orographically caused jet streams to appear over the Central Asian mountain systems, whose orientation generally coincides with the western wind trend. 894 TEMPORAL VARIABILITY OF TOTAL OZONE IN THE ASIAN REGION INFERRED 895 208 347 209 Fig. 1. Location of ground-based observation stations: (208) Huang He, (209) Kunming, and (347) Issyk-Kul. Their occurrence is caused by drastic differences in characteristics of the air masses over the plains and mountains, especially at the boundary between them. Mountain systems and the Tibet Plateau, warming up in summer and cooling down in winter, affect the local circulation features (Atmosphere…, 1991). Ground-based TOC monitoring stations are few in this area. Long-term continuous TOC measurements have been carried out since 1979 at the Issyk-Kul Station in the northwestern part of the studied region and at the Huang He Station near Beijing and, since 1980, at the Kunming Station in the southeast of China. Additional observations were initiated at four stations since 1990, including the Lhasa Station in the Tibet Plateau. The observations at these stations are distinguished by a relatively drastic variability in TOC with a high TOC content at the stations located in the northern part of the studied region and a relatively low TOC content in the south and over the Tibet Plateau (Zhou et al., 1995; Visheratin et al., 2006; Bian et al., 2011). The lower TOC areas of the Tibet Plateau, especially in summer, are explained largely by effect of the convective flows (Zhou et al., 1995; Bian et al., 2011). Another possible reason for the TOC latitudinal variability, in our opinion, is the abovementioned peculiarity of the atmospheric circulation, including the presence of high-altitude jet streams. IZVESTIYA, ATMOSPHERIC AND OCEANIC PHYSICS This investigation objective is to study the TOC temporal variability in the Asian Region by comparing the longest term measurement data obtained at the groundbased TOC monitoring stations and the satellite measurement data obtained with the SBUV/SBUV2, OMI, and TOU instruments. The conventional methods of statistical and spectral analyses are supplemented by composite and cross-wavelet analyses. CHARACTERISTICS OF THE USED DATA The ground-based and satellite measurement data and the corresponding equipment used in the analysis are described below in brief. We have used the average monthly TOC values for 1980–2013 obtained at three observation stations included in the global ozonometric network (WOUDC, 2013). Huang He (No. 208), Kunming (No. 209), and Issyk-Kul (No. 347) stations are located at a distance of 3000 km from each other and cover a major part of the Central Asian and Tibet Plateau mountain systems (Fig. 1). The Huang He Station (No. 208) is located near Beijing (39.9° N, 117.0° E, 50 m above sea level); the Kunming Station (No. 209) is located in the southeast of China (25.0° N, 102.7° E., 1920 m above sea level), in the subtropical highlands. Measurements at the Vol. 53 No. 9 2017 896 VISHERATIN et al. Table 1. Parameters of formula (1) according to groundbased and satellite measurement data on TOC for the period of 1980–2013 Station G208 S208 G209 S209 G347 S347 А12 37.6 39.7 19.8 17.8 31.7 33.4 Р12 А6 Р6 S0 –0.04 0.12 –1.58 –1.40 –0.01 –0.08 0.6 0.7 3.8 4.8 7.2 6.5 2.65 1.45 –2.27 –2.37 –0.32 –0.42 338.9 335.3 263.4 266.4 334.4 325.9 B*120 –0.2 –2.2 1.2 0.4 –7.9 –3.1 Huang He and Kunming stations are conducted using Dobson No. 075 and Dobson No. 003 devices, respectively. Both instruments are periodically calibrated with a regional standard, Dobson No. 116, Japanese Meteorological Agency (JMA). The Issyk-Kul Station (No. 347) is located on the northern shore of the highaltitude Lake Issyk-Kul (Kyrgyz Republic) (42.6° N, 77.0° E., 1650 m above sea level). The TOC measurements are carried out with the help of a spectrophotometric device (SPSD) using a multiwave method (Semenov et al., 1983). The random error of a single TOC measurement is 0.6%. The verification measurements have been carried out with Dobson No. 108 (Voeikov Main Geophysical Observatory) and Brewer No. 44 (Research and Production Association Typhoon) spectrophotometers in order to determine the systematic error of TOC measured with the SPSD. The systematic deviations of the TOC measurement results obtained with the SPSD and Dobson No. 108 and Brewer No. 44 spectrophotometers do not exceed 2% (Visheratin et al., 2006). The satellite measurement data obtained over the points with coordinates of the ground-based ozonometric stations were compiled on the basis of several databases. Until recently, the TOC spacetime variations were commonly analyzed using the satellite measurement data obtained with TOMS and OMI supplemented with the SBUV/SBUV2–TOMS-SBUV merged total ozone data (for example, (Fioletov et al., 2008; Visheratin and Kuznetsov, 2012; Chehade et al., 2013). However, the latest version of the merged database was released in 2011 (Vers. 8) and has not been updated since that time. Therefore, we have used the data recommended in (Labow et al., 2013; McPeters et al., 2013) that are based on the SBUV/SBUV2 measurements (SBUV merged total and profile ozone data, Vers. 8.6). It should be noted that one of reasons for the recommendations by (Labow et al., 2013; McPeters et al., 2013) is a systematic offset between the EP-TOMS data and currently functioning OMI, which has not been explained yet. Therefore, a comparison with the data of the Chinese TOU (Total Ozon Unit) device installed on the FengYun-3/A satellite (Wang et al., 2010, 2012; Bai et al., 2013) is of interest. Our investigation has been carried out using the TOC values over the points with geographic coordinates of the ground-based stations (overpass data) provided in the SBUV merged total and profile ozone data, Vers. 8.6 (hereinafter, V86) (ftp://toms.gsfc. nasa./pub/sbuv/MERGED), for the period of 1980– 2013; OMI data (http://avdc.gsfc.nasa.gov) for 2009– 2013; and TOU data for 2009–2013 (http://satellite. cma.gov.cn). Both ground-based and satellite data have minor gaps in measurements. Therefore, such omissions were filled in advance. For this purpose, a linear trend has been subtracted from the series, and the annual and semiannual harmonics parameters have been determined by Fourier analysis. An amplitude and a phase of the analyzed series are shown in Table 1. The variation parameters given in Table 1 are significant within 1 sigma. The S0 and B trends (U/decade) have been calculated by the average annual data and are not significant for all series. The general function approximating the annual and semiannual components of the TOC variations has the following form: Y = S(0) + B 120N + A12 sin(P12 + 2π N 12) + A6 sin(P6 + 2π N 6), (1) where А12 and А6 are amplitudes (U), Р12 and Р6 are phases of annual and semiannual harmonics (radians), S0 (U) and B (U/decade) are trend parameters, and N is the serial number of the month beginning in January 1980. The TOC values calculated by (1) have been added instead of the omissions in the original series. Additional calculations with the inclusion of the harmonics with a period of 3 and 4 months resulted in a slight difference. In Table 1 and hereinafter in the paper, for the sake of brevity, the ground-based station data are indicated by station numbers with a letter G (ground) added, while the satellite data are indicated with station numbers with a letter S (satellite). Upon a relatively good agreement between the ground-based and satellite parameters, the phases of half-year harmonics are greatly different for the Huang He Station (208), and all stations are characterized by differences in the trend value. ANALYSIS OF THE RESULTS One of the conventional methods for comparing the ground-based and satellite data (Fioletov et al., 2008, Bai et al., 2013) is calculating the relative deviation (Δ): Δ = (G(i) – S(i))/G(i). (2) The relative deviation values are shown in Fig. 2. Station 208 is characterized by some excess of the ground measurement data over the satellite data at an average Δ of about 2% throughout the studied period. It should be noted that this station was distinguished IZVESTIYA, ATMOSPHERIC AND OCEANIC PHYSICS Vol. 53 No. 9 2017 TEMPORAL VARIABILITY OF TOTAL OZONE IN THE ASIAN REGION INFERRED IZVESTIYA, ATMOSPHERIC AND OCEANIC PHYSICS (a) 10 5 0 –5 –10 1980 1985 1990 1995 2000 (b) 2005 2010 1985 1990 1995 2000 (c) 2005 2010 1985 1990 1995 2000 Year 2005 2010 10 5 Δ, % by the systematic data offset in comparison with the SCIAMACHY and OMI data in (Zheng and Wei, 2010). As for stations Nos. 209 and 347, the average Δ value is less than 1% throughout the studied period. Meanwhile, we should note the underestimated results of station 347 in the period of 2000–2011. The reasons for such a TOC trend at station 347 require additional studies. The linear deviation trend between the ground-based and satellite measurement data is the greatest for station 208, yet is negligible like for the other two stations. In general, the ground-based and satellite measurement data are in good agreement at all three stations. As follows from an analysis of the TOMS and OMI data (Labow et al., 2013), there is a systematic discrepancy (the OMI values are lower than those of TOMS) caused the recommendations to use the SBUV/SBUV2 data. Figure 3 shows the comparison results obtained for the ground-based data and V86, OMI and TOU for 2009–2013. In the case of station 208, the V86, OMI, and TOU data are in good agreement with each other, while the average satellite values throughout the studied period are 2.7, 2.5, and 1.6%, respectively, lower than the ground-based data. As for station 209, the systematic underestimation of the satellite data is observed only for the OMI device, reaching 2%. The V86 and TOU data are consistent with each other and with the data of station 209 within 1%. As for station 347, the period until 2011 can be pointed out, when the satellite data were on average above the ground-based measurement values. Since 2011, the satellite data were in good agreement with each other and exceeded station 347 measurement values by 2%, on average throughout the studied period. We should note one more common trend well-defined for stations Nos. 208 and 209: the greatest differences from the ground-based measurement data (5–7%) were noted in the summer period. In general, the SBUV/SBUV2, OMI, and TOU data are in good agreement with each other over stations Nos. 347 and 208 located in the northern part of the considered region. Above station 209 located in the southeast in a mountain area, the OMI results are understated by 2–3%, on average. Let us consider the comparison of the groundbased and satellite measurement data more thoroughly by spectral, cross-wavelet, and composite analysis. The spectral analysis has been carried out using the modified Lomb–Scargle (LS) Fourier transform (Scargle, 1982), having a number of advantages in comparison with other spectral analysis methods. The linear trend has been preliminary removed from the data. The value of the spectral harmonics (peaks) in the spectra has been estimated by the method of (Scargle, 1982; Baluev, 2008). Due to the fact that the annual harmonic amplitudes are 6–10 times greater than amplitudes of the longer period oscillations, the time series have been preliminary “whitened,” that is to say, the oscillations 897 0 –5 –10 1980 10 5 0 –5 –10 1980 Fig. 2. Relative deviation Δ (%) between the ground-based and satellite (V86) measurement data on TOC for the period of 1980–2013: (a) Huang He Station (208), (b) Kunming Station (209), and (c) Issyk-Kul Station (347). with periods from 3 to 13 months have been removed (annual oscillation and its harmonics). The algorithms for calculations by various spectral methods are described in detail in (Visheratin and Karmanov, 2008). The results of the spectral analysis are shown in Fig. 4 separately for the ground-based and satellite data. For demonstrative purposes, the spectra in the region of 14–30 and 30–150 months are shown separately. Although the annual harmonic amplitude is almost twice as low at station 209 than that at stations 208 and 347 located in the northern part of the studied region (Table 1), the variation amplitudes with a period of more than 14 months are similar to those obtained at stations 208 and 347. A spectral structure of the satellite and ground-based data is almost similar for both the main (significant at the level of 0.05) oscillations and a number of other oscillations. The distribution of amplitudes and oscillation periods in the region of more than 14 months is very similar for all analyzed series. Table 2 shows, as an example, the minimum and maximum periods of main oscillations over three considered stations and average amplitudes of these oscillations. Figure 4 shows two stable oscillations with periods of about 21 and 28 months. Oscillations with a period of about 28 months (quasi-biennial oscillations, QBO) are commonly related to variations in the equaVol. 53 No. 9 2017 898 VISHERATIN et al. (a) 15 V86 10 OMI TOU 5 0 –5 –10 2009 2010 2011 2012 2013 2014 2012 2013 2014 2012 2013 2014 (b) 15 10 Δ, % 5 0 –5 –10 2009 2010 2011 (c) 15 10 5 0 –5 –10 2009 2010 2011 Year Fig. 3. Relative deviation Δ(%) between the ground-based and satellite (V86, OMI, TOU) measurement data on TOC for the period of 2009–2013, stations (a) Huang He, (b) Kunming 4, and (c) Issyk-Kul. torial stratospheric wind (Gray and Pyle, 1989). The range which the TOC quasi-biennial oscillations can be attributed to is limited to the periods from 24–25 to 35–36 months, because only these oscillations are characterized by the dramatic maxima exactly above the equator and the symmetrical minima near (10– 12)°S and (10–12)°N. The equatorial region is characterized by the most intensive oscillations with periods of 28–29 and 32–33 months, while the maxima of extratropical quasi-biennial oscillations are observed in both hemispheres near 40–50° (Visheratin and Kuznetsov, 2012). It was assumed that the beats between the basic frequencies could lead to oscillations at the combination frequencies (Bohme, 1965). It was proposed to modulate TOC QBO by circulation processes with a period that is equal to the annual harmonic period (Tung and Yang, 1994). The multiplicative modulation model proposed in this paper can be presented as follows: ⎛ 2πt ⎞ ⎡ ⎛ 2π t ⎞⎤ ⎟ ⎢ A + B sin ⎜ T ⎟⎥ sin ⎜T ⎣ ⎝ 12 ⎠⎦ ⎝ QBO ⎠ ⎛ ⎞ ⎛ ⎞ ⎛ ⎞ = A sin ⎜ 2πt ⎟ + B sin ⎜ 2π t ⎟ + B cos ⎜ 2πt ⎟ , ⎝ T− ⎠ 2 ⎝ T+ ⎠ ⎝TQBO ⎠ 2 (3) Table 2. Basic periods (Tmin, Tmax, months) and average amplitudes (A, DU) of oscillations over stations 208, 209, and 347 based on satellite data Tmin Tmax A 120.0 125.0 2.9 89.0 90.0 2.9 58.0 59.0 2.3 45.0 49.0 2.4 34.7 36.3 2.4 31.0 31.7 1.7 27.2 28.1 3.5 22.8 23.2 3.1 20.9 21.3 3.4 IZVESTIYA, ATMOSPHERIC AND OCEANIC PHYSICS 18.3 18.6 1.9 15.0 15.4 2.4 Vol. 53 No. 9 14.3 14.4 2.4 2017 TEMPORAL VARIABILITY OF TOTAL OZONE IN THE ASIAN REGION INFERRED (a) 4 4 2 2 0 0 (b) 4 Spectral amplitude, DU 899 4 2 2 0 4 0 4 (c) 2 2 0 4 0 4 (d) 2 2 0 6 0 6 (e) 4 4 2 2 0 6 0 6 (f) 4 4 2 2 0 0 15 20 25 30 50 100 150 Period, month 200 Fig. 4. TOC spectral amplitudes inferred from the ground-based measurement data: (a) G208, (c) G209, and (e) G347, and satellite data (b) S208, (d) S209, and (f) S347. Horizontal straight lines correspond to a confidence probability of 95%. where А and В are constant and variable parts of the annual oscillation Т12, TQBO is a period of QBO, and Т_ and Т+ are oscillation periods corresponding to the difference and the total of original frequencies Т12 and TQBO. For the data from Table 2: Т_ = 1/(1/12 – 1/28) = 21 months and Т+ = 1/(1/12 + 1/28) = 8.4 months. Analogously, the oscillation modulation with a period of about 35 months leads to the oscillations with periods of 8.9 and 18.2 months. Oscillations with similar periods are observed in the considered spectra, but amplitudes of these oscillations are much lower than the B/2 value. The additive modulation model can be constructed in an analogous way (Kiefer, 2015). In this case, the combination frequencies originating from summing up of oscillations have doubled period values relative to (3). The disadvantage of these interpretations consists of the absence or inadequate validity of the physical mechanisms providing conditions for the occurrence of a particular combination frequency. IZVESTIYA, ATMOSPHERIC AND OCEANIC PHYSICS In the TOC spectrum there are also a number of oscillations in the range of 4–5 and 8–13 years, which are commonly related in the literature to the El Nino phenomenon and the 11-year solar activity (SA) cycle. The wavelet and composite analyses are used for a more thorough analysis of these oscillations. The cross-wavelet transformation for the joint analysis of two time series was proposed in (Torrence and Compo, 1998; Grinsted et al., 2004). This method makes it possible to determine the correlation degree and phase relations between two series in the time– frequency space, as well as to estimate the correlation ratios by the Monte Carlo method, taking into account the red-noise processes (series autocorrelation). Figure 5a shows the cross-wavelet analysis data on the TOC series inferred from the ground-based and satellite data for station 208. Just as in the spectral analysis, the linear and seasonal trends have been preliminary excluded from the time series. Vol. 53 No. 9 2017 900 VISHERATIN et al. (a) 0 –5 5 Period, month 16 32 64 TOC, DU 128 1980 4 2 0 –2 –4 1980 1985 1990 1995 2000 2005 2010 (b) 2 1 1985 1990 1995 2000 2005 3 2010 Year Fig. 5. (a) Cross-correlation wavelet analysis of the total ozone series according to the ground-based and satellite data for Huang He Station 208. The correlation degree (color scale) is given in r.u. A thick black line draws out the areas with a confidence interval of more than 95%. The arrows show the relationship between the time-series phases: to the right, in phase; to the left, in antiphase; downwards, G208 variations are ahead of S208 by 90°; upwards, they are behind by 90°. (b) Composite series according to the ground-based (1) and satellite (2) data in the range of 8–13 years and solar-activity variations (3). As follows from Fig. 5a, the TOC interannual oscillations for a significant part of the periods and temporal oscillations occur in the same phase. Meanwhile, in the last decade, the maximum ozone oscillations from ground-based measurements have been ahead of the maximum satellite oscillations for periods of more than 90 months, and the oscillations have been close to the antiphase for the periods of more than 140 months. The peaks with periods of about 90 and 120 months correspond to these TOC long-term variations in the spectra shown in Fig. 4. Figures 6a and 7a show the cross-wave transformation results for stations 209 and 347. The phase relationships between the satellite and ground-based data in the long-period oscillation region are in good agreement at these stations. Meanwhile, some time ranges are marked by differences between the satellite and ground-based data in the quasi-quinquennial oscillation region (4–6 years). Variations in ozone and other atmospheric parameters with such periods are commonly related to large-scale processes in the Pacific Ocean such as the El Nino and La Nina phenomena and atmosphere center transformations (Nerushev, 2003). Phase differences are the most noticeable for station 209 located in the south of the studied region. At this station, in the period from 1987 to 2005, the TOC variations in the region of 4–6 years inferred from the satellite and ground-based data were close to the antiphase variations. The composite method has been used to estimate the phase relationships in the field of quasi-decennial oscillations (QDO); this method makes it possible to filter out the oscillations in the selected spectrum segments (Visheratin, 2012). The composite temporal series were formed as follows: the first stage involved a calculation of the direct Fourier transformation (FT) factors; the second stage involved the reverse FT to form the temporal series (Figs. 5b–7b) containing the total of harmonics in the range from 8 to 13 years. The phase relationships between the ground-based and satellite data for the station 208, obtained by the composite method, are in relatively good agreement with the cross-wavelet analysis data (Fig. 5a) and confirm discrepancies in the TOC QDO phases with the help of the independent method. The reasons for such discrepancies are not clear. It is interesting to compare the TOC quasi-decennial oscillations with the 11-year solar activity (SA) cycle. The phase relationships between TOC QDO and 11-year SA cycle were previously discussed by the example of the longest ozone series (Arosa Station, Switzerland) and the TOC average zoned fields in (Visheratin, 2012; Visheratin, 2015). According to these works, the phase of TOC QDO maxima coincides with that of SA maxima in the tropic regions and is ahead of the SA maxima in the middle latitudes of the Northern Hemisphere. As follows from Fig. 5b, the ozone oscillations were higher than SA variations in the 23rd solar-activity cycle, according to station 208 data; in the current 24th cycle, the oscillations were close to the antiphase. At station 347, the ozone variations are also higher than the SA variations on average, which is seen better when comparing the variation minima. At IZVESTIYA, ATMOSPHERIC AND OCEANIC PHYSICS Vol. 53 No. 9 2017 TEMPORAL VARIABILITY OF TOTAL OZONE IN THE ASIAN REGION INFERRED –5 –4 –3 –2 (a) 0 –1 1 2 3 4 5 Period, month 16 32 64 128 1980 1985 1990 1995 5 TOC, DU 2000 2005 2010 (b) 2 1 3 0 –5 1980 1985 1990 1995 2000 2005 2010 Year Fig. 6. Same as in Fig. 5 for Kunming Station 209. –5 –4 –3 –2 –1 (a) 0 1 2 3 4 Period, month 16 32 64 128 TOC, DU 1980 5 1985 1990 1995 (b) 2000 2005 2 1 2010 3 0 –5 1980 1985 1990 1995 2000 2005 Year Fig. 7. Same as in Fig. 5 for Issyk-Kul Station 347. IZVESTIYA, ATMOSPHERIC AND OCEANIC PHYSICS Vol. 53 No. 9 2017 2010 5 901 902 VISHERATIN et al. station 209 located southwards, the TOC quasidecennial phase is similar to the SA 11-year phase. CONCLUSIONS We have analyzed the satellite and ground-based measurement data on the total ozone content in the studied region covering the Central Asian and Tibetan Plateau mountains by both conventional methods and spectral, cross-wavelet, composite analyses. For the period of 1980–2013, a relative average deviation from the SBUV/SBUV2 is less than 1% at the Kunming (209) and Issyk-Kul (347) stations, while the Huang He Station (208) is characterized by an excess of satellite measurement data over the ground-based data at an average deviation of 2%. As for the SBUV/SBUV2, OMI, and TOU satellite data for a shorter period, from 2009 to 2013, in general, the measurement results are consistent within 3%. The TOU data are in agreement with SBUV/SBUV2 within 1%. A comparison of the satellite and ground-based data by spectral, cross-wavelet, and composite analysis has made it possible to evaluate systematic offsets between the analyzed data at a time–frequency plane and, in addition, estimate the phase relationships between the analyzed series. It stands to mention the similarity of the interannual variation spectra at the stations located at considerable distances from each other and separated by large mountains. The characteristic regional jet streams can be one of possible factors of oscillation synchronization and spacetime variability of TOC (Atmosphere…, 1991). Meanwhile, according to the cross-wavelet and composite analyses results, with a slight relative deviation of the satellite and ground-based data and the spectra similarity, the phase relationships between the studied series can be subject to considerable variations. For example, the oscillation phases in the region of 5–7 years in 1990– 2000 are almost opposite at station 209. The phase relationships are different between the 11-year solar activity cycle and ozone variations inferred from the satellite and ground-based data obtained at the stations located in the north and the south. The oscillation phase at the Kunming Station is similar to that of the 11-year solar cycle, while TOC variations are higher than the solar cycle variations at the Huang He and Issyk-Kul stations. ACKNOWLEDGMENTS We thank NASA, NOAA, WOUDC, and SIDC scientists for giving us access to their databases. This work was carried out under cooperation between the Federal Service for Hydrometeorology and Environmental Monitoring of Russia and Chinese Meteorology Department (project no. 1.3) with partial support from the Russian Foundation for Basic Research (projects nos. 14-05-00127, 14-05-90104). REFERENCES Atmosfera: Spravochnik (The Atmosphere: A Handbook), Leningrad: Gidrometeoizdat, 1991. Bai, K., Liu, Ch., Shi, R., Zhang, Y., and Gao, W., Global validation of FY-3A total ozone unit (TOU) total ozone columns using ground-based brewer and Dobson measurements, Int. J. Remote Sens., 2013, vol. 34, no. 14, pp. 5228–5242. Baluev, R.V., Assessing statistical significance of periodogram peaks, Mon. Not. R. Astron. Soc., 2008, vol. 385, no. 3, pp. 1279–1285. Bian, J.C., Yan, R.C., Chen, H.B., Lu, D., and Massie, S.T., Formation of the summertime ozone valley over the Tibetan Plateau: The Asian summer monsoon and air column variations, Adv. Atmos. Sci., 2011, vol. 28, no. 6, pp. 1318–1325. doi 10.1007/s00376-011-0174-9 Bohme, W., A change of circulation pattern in middle latitudes in connection with the 26-month cycle, in Trudy Mezhdunarodnogo Simposiuma “Dinamika krupnomasshtabnykh atmofernykh protsessov” (Proceedings of the International Symposium “Dynamics of LargeScale Atmospheric Processes”), Moscow: Nauka, 1965, pp. 402–409. Chehade, W., Weber, M., and Burrows, J.P., Total ozone trends and variability during 1979–2012 from merged datasets of various satellites, Atmos. Chem. Phys., 2014, vol. 14, no. 13, pp. 7059–7074. doi 10.5194/acp-147059-2014 Echer, E., Multi-resolution analysis of global total ozone column, Ann. Geophys., 2004, vol. 22, pp. 1487–1493. Ermolli, I., Matthes, K., Dudok de Wit, T., Krivova, N.A., Tourpali, K., Weber, M., Unruh, Y.C., Gray, L., Langematz, U., Pilewskie, P., Rozanov, E., Schmutz, W., Shapiro, A., Solanki, S.K., and Woods, T.N., Recent variability of the solar spectral irradiance and its impact on climate modelling, Atmos. Chem. Phys., 2013, vol. 13, pp. 3945–3977. doi 10.5194/acp-13-3945-2013 Fioletov, V.E., Labow, G.J., Evans, R., Hare, E.W., Kohler, U., McElroy, C.T., Miyagawa, K., Redondas, A., Savastiouk, V., Shalamyansky, A.M., Staehelin, J., Vanicek, K., and Weber, M., Performance of the ground-based total ozone network assessed using satellite data, J. Geophys. Res., 2008, vol. 113, D14313. doi 10.1029/2007JD009809 Gray, L.J. and Pyle, J.A., A two-dimensional model of the quasi-biennial oscillation of ozone, J. Atmos. Sci., 1989, vol. 46, pp. 203–220. Grinsted, A., Moore, J.C., and Jevrejeva, S., Application of the cross wavelet transform and wavelet coherence to geophysical time series, Nonlinear Processes Geophys., 2004, no. 11, pp. 561–566. doi 10.5194/npg-11-5612004 Izrael, Yu.A., Belokrinitskaya, L.M., Dvoretskaya, I.V., Dorokhov, V.M., Ivanov, K.A., Kruchenitskii, G.M., Shepelev, D.V., and Yusipov, T.A., Comparison of ground-based and satellite measurements of total ozone, Russ. Meteorol. Hydrol., 2014, vol. 39, no. 6, pp. 420–430. Kiefer, R., Schad, A., Herzberg, W., and Roth, M., Determination of fundamental asteroseismic parameters using the Hilbert transform, Astron. Astrophys., 2015, vol. 578, no. A56. doi 10.1051/0004-6361/201425474 IZVESTIYA, ATMOSPHERIC AND OCEANIC PHYSICS Vol. 53 No. 9 2017 TEMPORAL VARIABILITY OF TOTAL OZONE IN THE ASIAN REGION INFERRED Labow, G.J., McPeters, R.D., Bhartia, P.K., and Kramarova, N., A comparison of 40 years of SBUV measurements of column ozone with data from the Dobson/Brewer network, J. Geophys. Res. Atmos., 2013, vol. 118, pp. 7370–7378. Murple, S.L., Jr., Digital Spectral Analysis with Applications, Upper Saddle River, New Jersey, Prentice-Hall, 1986; Moscow: Mir, 1990. McPeters, R.D., Bhartia, P.K., Haffner, D., Labow, G.J., and Flynn, L., The version 8.6 SBUV ozone data record: An overview, J. Geophys. Res.: Atmos., 2013, vol. 118, pp. 8032–8039. Nerushev, A.F., Vozdeistvie intensivnykh atmosfernykh vikhrei na ozonovyi sloi Zemli (Influence of Intense Atmospheric Vortices on the Earth’s Ozone Layer), St. Petersburg: Gidrometeoizdat, 2003. Scargle, J.D., Studies in astronomical time series analysis. Statistical aspects of spectral analysis of unevenly spaced data, Astrophys. J., 1982, vol. 263, pp. 835–853. Semenov, V.K., Spektorov, L.A., and Timofeeva, S.S., Variations in the ozone total content in region of Lake Issyk-Kul’, in Atmosfernyi ozon (Atmospheric Ozone), Moscow: Nauka, 1983, pp. 85–88. SIDC-team, World Data Center for the Sunspot Index, Royal Observatory of Belgium, Monthly Report on the International Sunspot Number, 2013. http://www.sidc. be/sunspot-data. Timofeev, Yu.M., Global’naya sistema monitoringa parametrov atmosfery i poverkhnosti (Global System of Monitoring of Atmospheric and Surface Parameters), St. Petersburg, 2010. Torrence, C. and Compo, G.P., A practical guide to wavelet analysis, Bull. Am. Meteorol. Soc., 1998, vol. 79, pp. 61– 78. Tung, K.K. and Yang, H., Global QBO in circulation and ozone. Pt. 1: Reexamination of observational evidence, J. Atmos. Sci., 1994, vol. 51, no. 19, pp. 2699–2707. Visheratin, K.N., Kamenogradskii, N.E., Kashin, F.V., Semenov, V.K., Sinyakov, V.P., and Sorokina, L.I., Spectral–temporal structure of variations in the atmospheric total ozone in central Eurasia, Izv., Atmos. Ocean. Phys., 2006, vol. 42, no. 2, pp. 184–202. IZVESTIYA, ATMOSPHERIC AND OCEANIC PHYSICS SPELL: OK 903 Visheratin, K.N., Relationship between phases of quasidecadal oscillations of total ozone and the 11-year solar cycle, Geomagn. Aeron. (Engl. Transl.), 2012, vol. 52, no. 1, pp. 94–102. Visheratin, K.N. and Kuznetsov, V.I., Spatial and temporal variations in the phase of major oscillations in the total ozone content according to TOMS-SBUV satellite measurement data, Sovrem. Probl. Distantsionnogo Zondirovaniya Zemli Kosmosa, 2012, vol. 9, no. 2, pp. 192–199. Visheratin, K.N., Quasidecadal variations of global average and zonal mean values of total ozone and some parameters of the lower stratosphere, in Proc. Int. Symp. “Atmospheric Radiation and Dynamics” (ISARD-2015), St. Petersburg, 2015, p. 290. Wang, W. and Zhang, X., An x., zhang y., huang f., wang y., zhang z. lu j. analysis for retrieval and validation results of fy-3 total ozone unit (tou), Chin. Sci. Bull, 2010, vol. 55, pp. 3037–3043. Wang, W., Flynn, L., Zhang, X., Wang, Y., Jiang, A., Zhang, Y., Huang, F., Li, X., Liu, R., Zheng, Z., Yu, W., and Liuet, G., Cross-calibration of the total ozone unit (TOU) with the ozone monitoring instrument (OMI) and SBUV/2 for environmental applications, IEEE Trans. Geosci. Remote Sens., 2012, vol. 50, no. 12, pp. 4043–4045. WMO (World Meteorological Organization), Scientific Assessment of Ozone Depletion, Global Ozone Research and Monitoring Project, 2014, Rep. no. 55. WOUDC (World Ozone and Ultraviolet Radiation Centre), Environment Canada, Toronto 2013. Zheng, X. and Wei, X., (2010). long-term total ozone comparisons between space and ground-based observations at sites of china, J. Appl. Meteorol., vol. 21, no. 1, pp. 1–10. Zhou, X., Luo, Ch., and Li, W., Atmospheric total ozone variation in china and anomalous low-value center of ozone over the tibetan plateau, Chin. Sci. Bull, 1995, vol. 40, no. (15), pp. 1396–1398. Translated by E. Maslennikova Vol. 53 No. 9 2017
